Using Speed Insights
To access Speed Insights:
- Select a project from your dashboard and navigate to the Speed Insights tab.
- Select the timeframe and environment you want to view data for.
- Use the panels to filter the page or event data you want to view.
Speed Insights offers a variety of views to help you analyze your application's performance data. This allows you to identify areas that need improvement and make informed decisions about how to optimize your site.
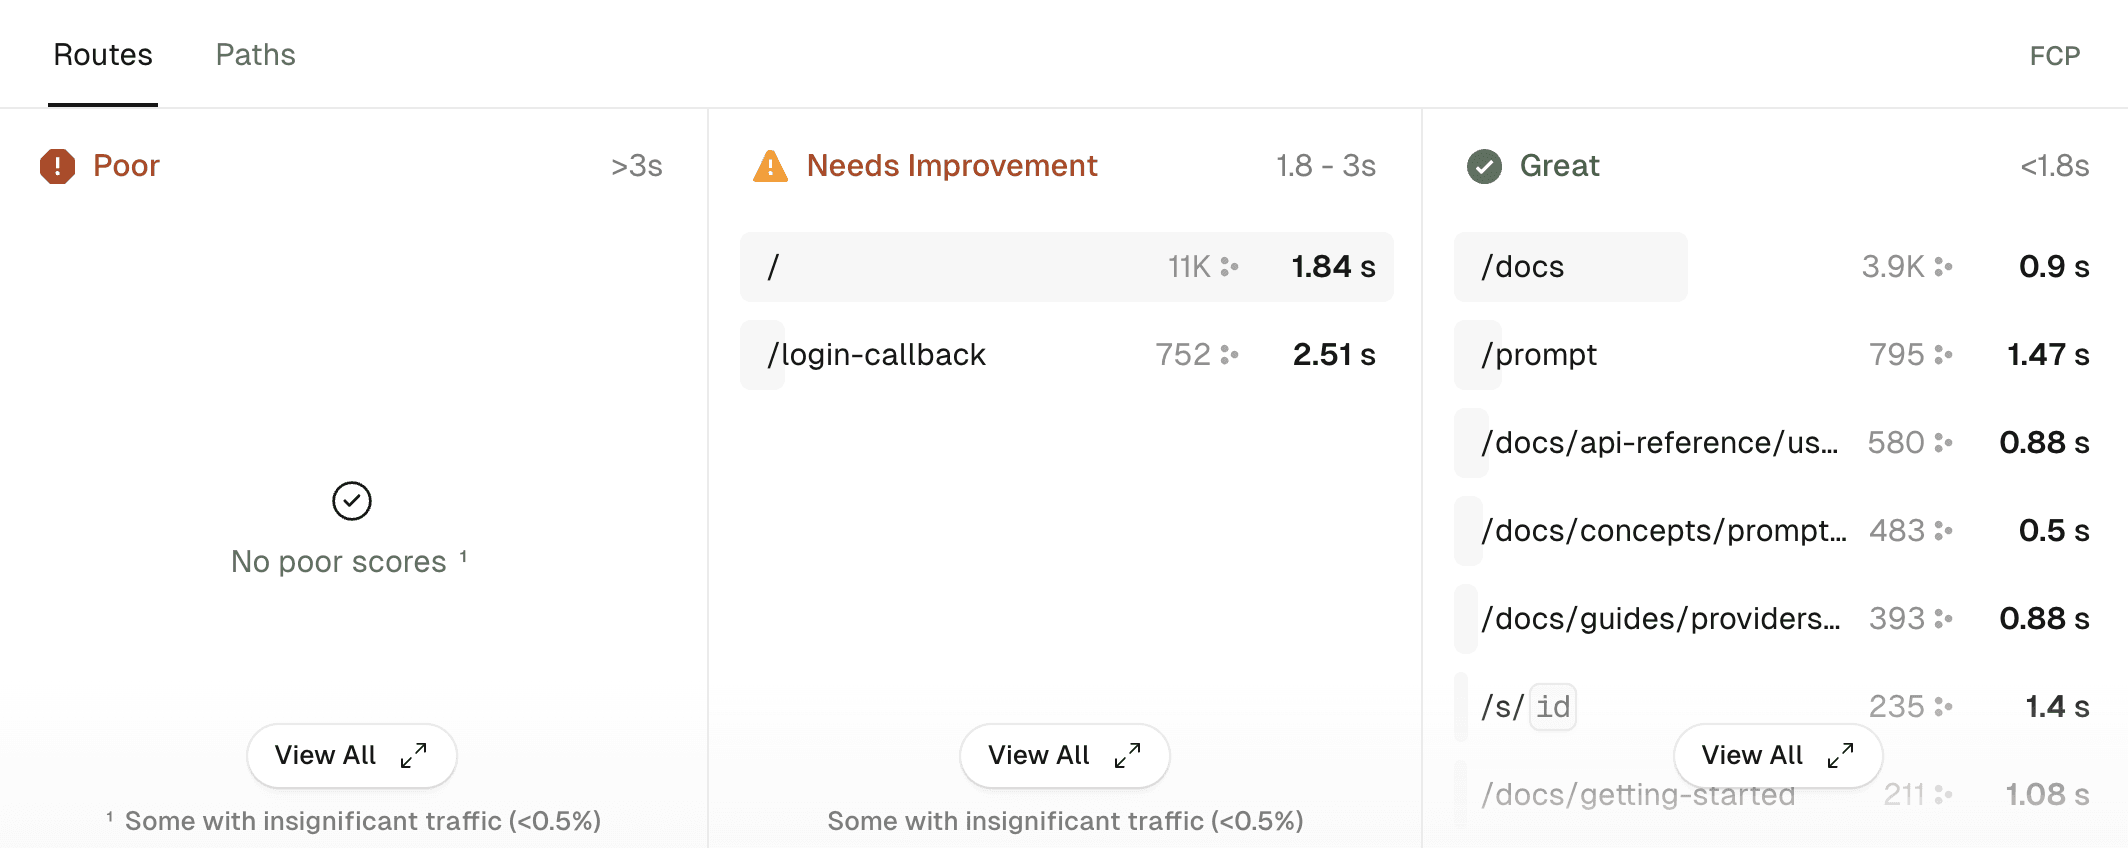
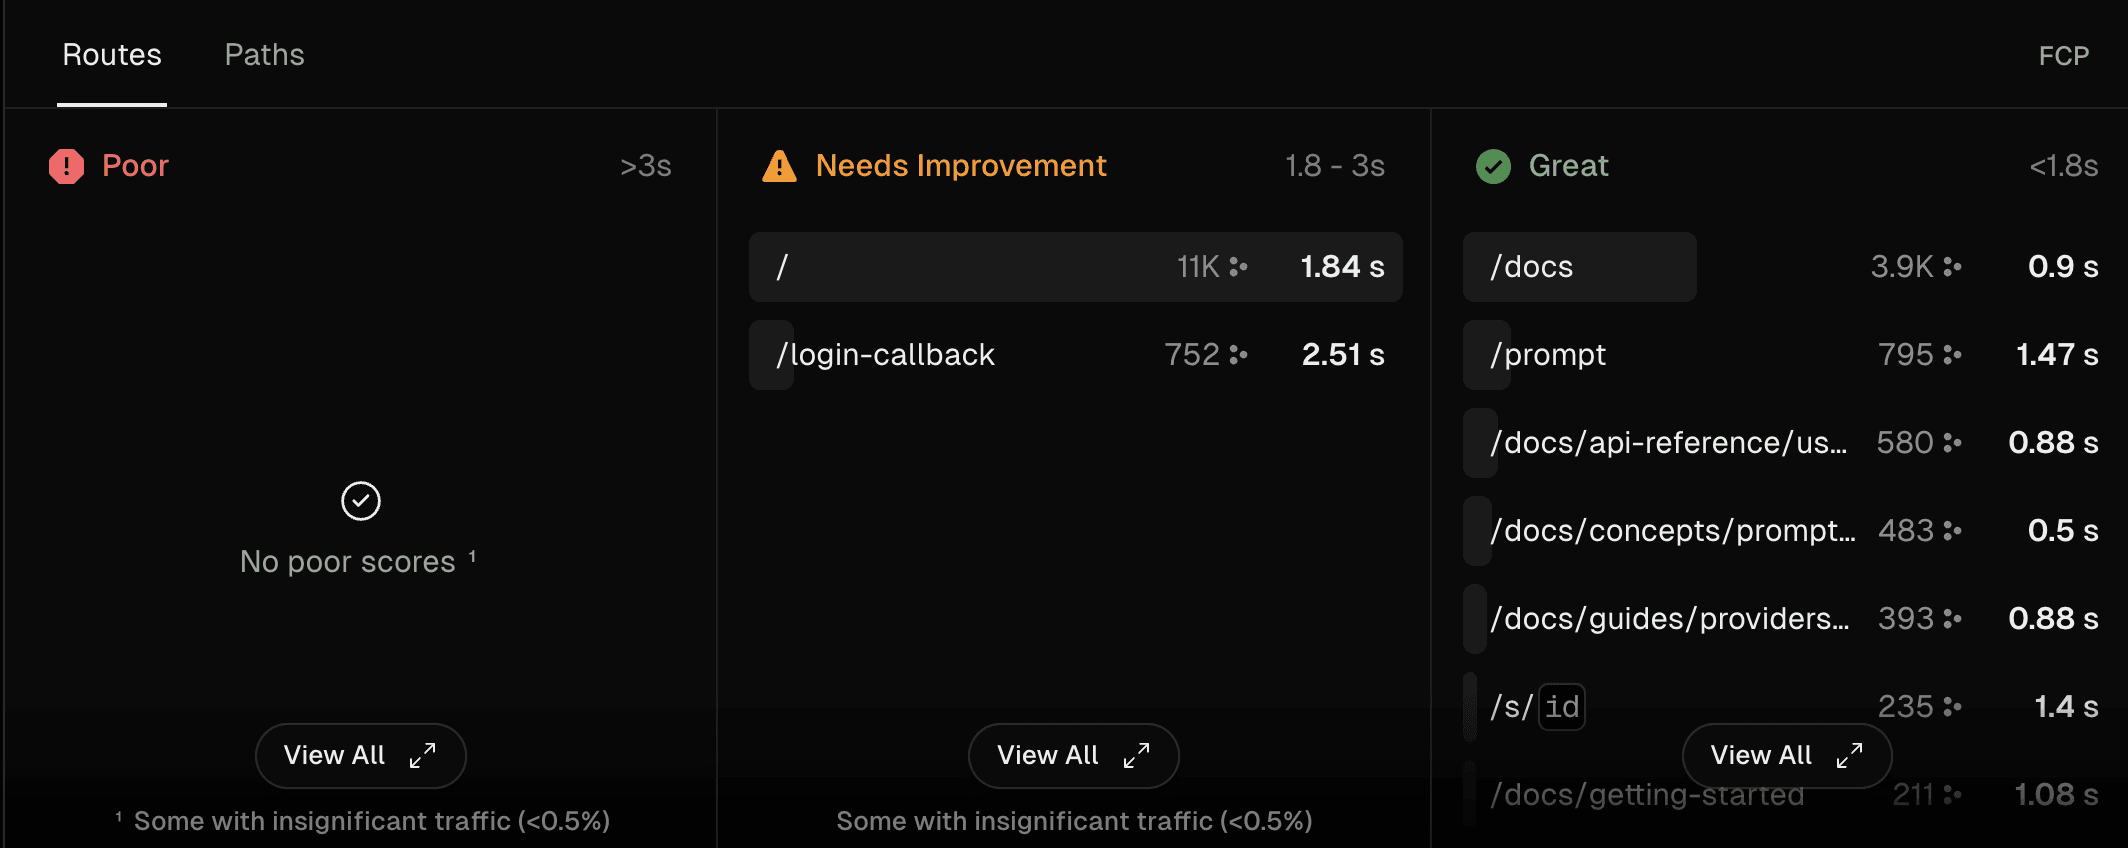
To view metrics for a specific route or path:
- Select a project from your dashboard and navigate to the Speed Insights tab.
- From the left-hand panel, select the metric you want to view data for.
- From the URL view, select the corresponding tab to view by the Route (the actual pages you built), or by Path (the URLs requested by the visitor).
- The information is organized by performance score and sorted by data points. Scroll the list to view more all paths or routes, or click the View all button to view and filter all data.
- You can also edit the timeframe and environment you want to view data for.
To view a detailed breakdown of the performance of individual HTML elements on your site:
- Select a project from your dashboard and navigate to the Speed Insights tab.
- From the left-hand panel, select the metric you want to view data for. HTML element attribution is only available for the following metrics:
- Interaction to Next Paint (INP)
- First Input Delay (FID)
- Cumulative Layout Shift (CLS)
- Largest Contentful Paint (LCP)
- From the URL view, select the Selectors tab.
- The information is organized by performance score and sorted by data points. Scroll the list to view more all elements, or click the View all button to view and filter all data.
- You can also edit the timeframe and environment you want to view data for.
This view is particularly useful for identifying specific elements that may be causing performance issues.
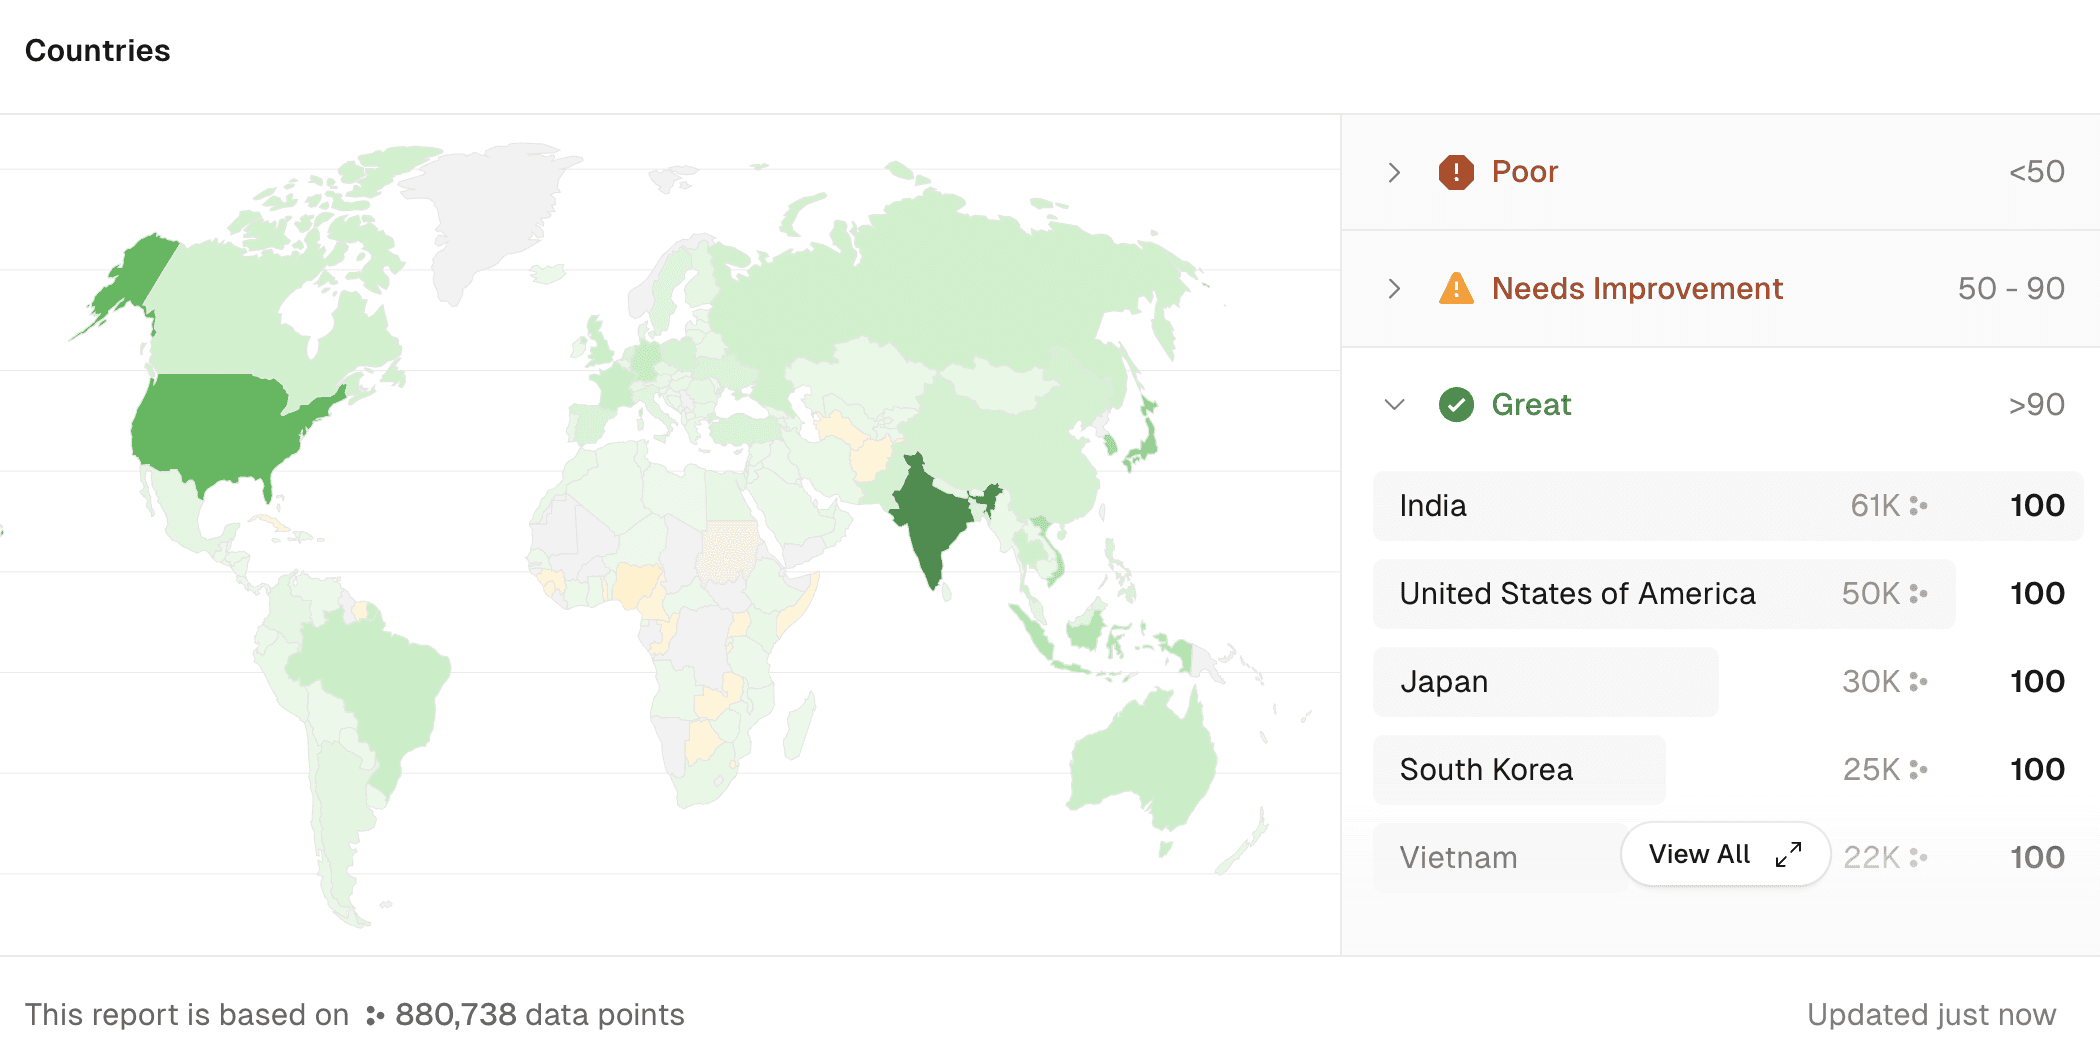
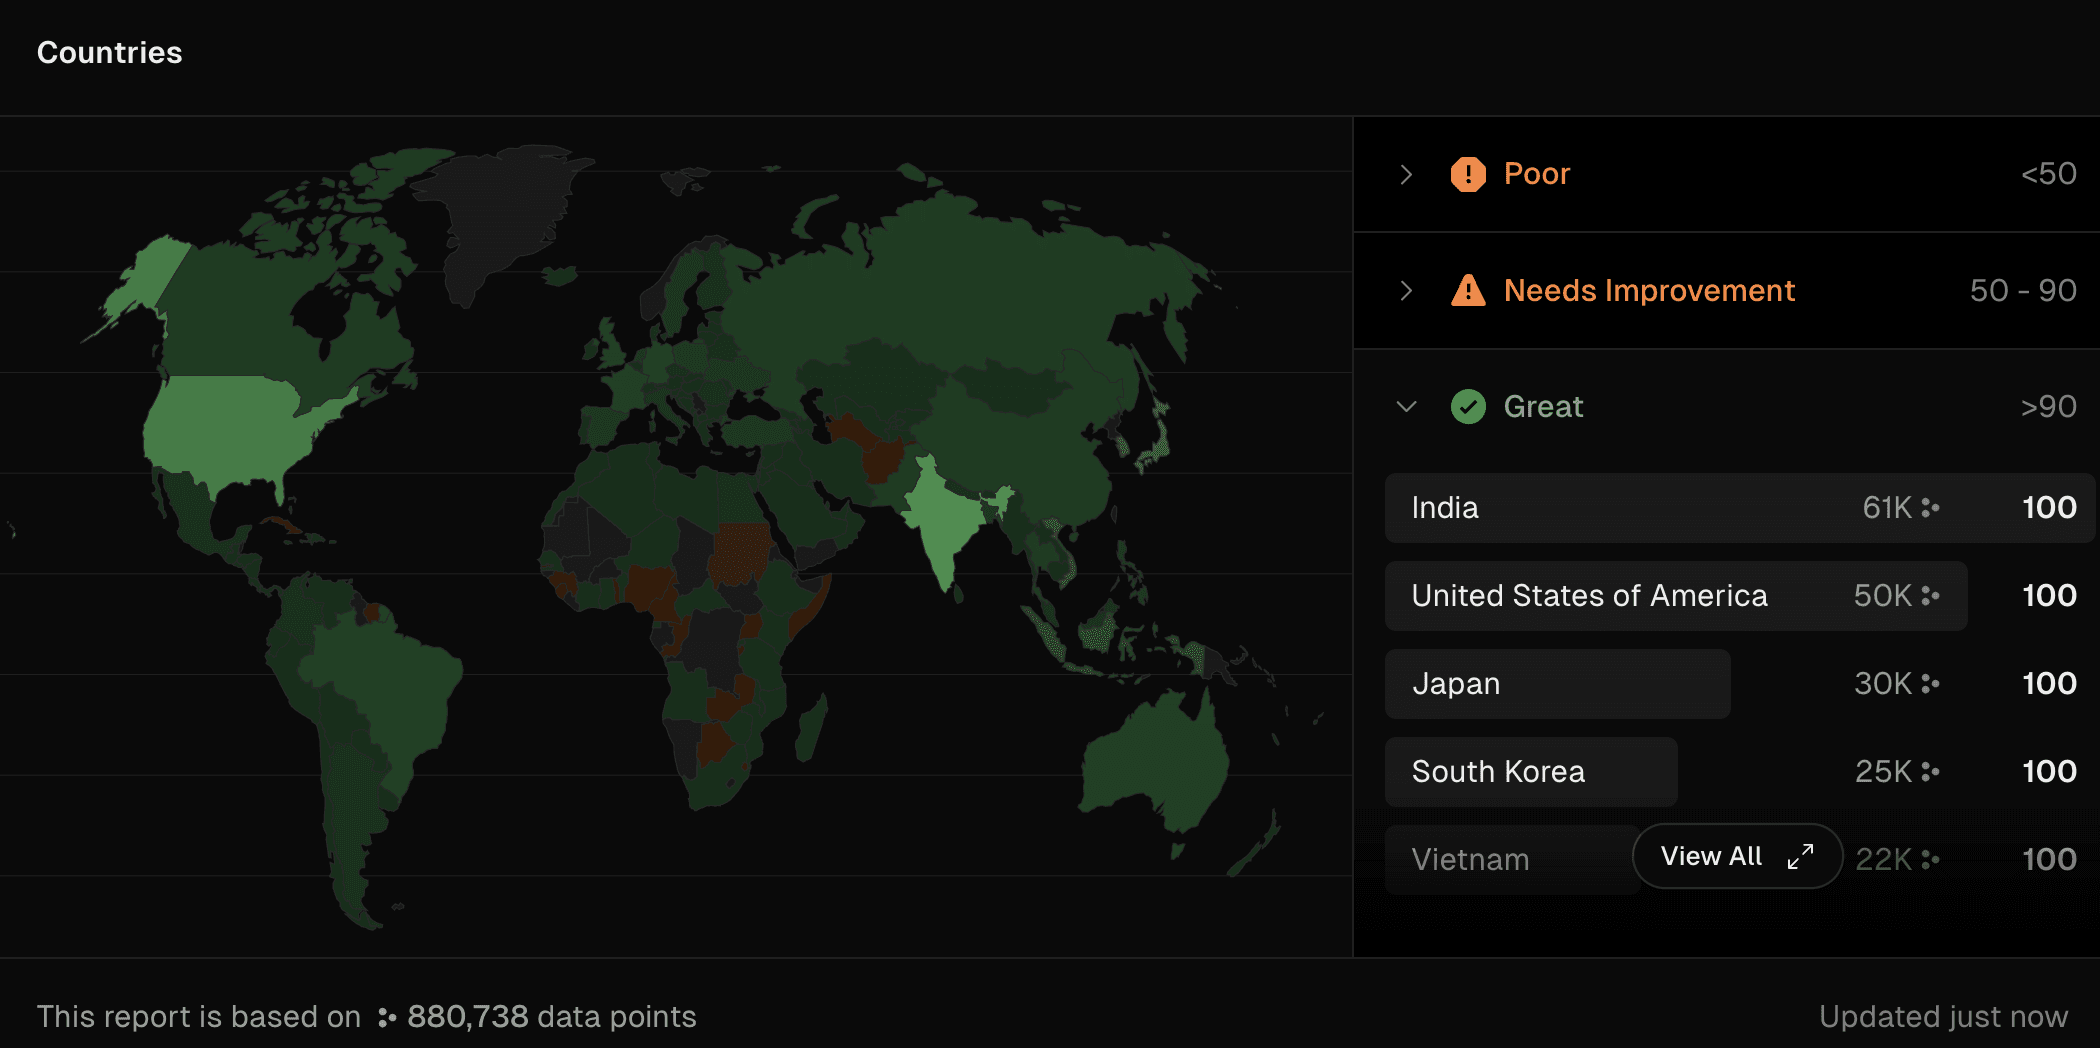
This view is helpful for identifying regions where your application may be underperforming.
To view a geographical breakdown of your application's performance:
- Select a project from your dashboard and navigate to the Speed Insights tab.
- From the left-hand panel, select the metric you want to view data for.
- Scroll down to the Countries section.
- The map is colored based on the experience metric per country. Click on a country to view more detailed data.
You may want to disable Speed Insights in your project if you find you no longer need it. You can disable Speed Insights from within the project settings in the Vercel dashboard. If you are unsure if a project has Speed Insights enabled, see Identifying if Speed Insights is enabled.
If you transfer a project with Speed Insights enabled from a Hobby team to a Pro plan, it will continue to be enabled but with increased limits, as documented in the pricing docs. This means that Speed Insights will be added to your Pro plan invoice automatically.
- Select a project from your dashboard.
- Navigate to the Speed Insights tab.
- Click on the ellipsis on the top-right of the Speed Insights page and select Disable Speed Insights.


When you disable Speed Insights in the middle of your billing cycle, it will not be removed instantly. Instead it will stop collecting new data points but will continue to show already collected data until the end of the cycle, see the prorating docs for more information.
If you are on an Enterprise plan, check your contract entitlements as you may have custom limits included. If you have any questions about your billing/contract regarding Speed Insights you can reach out to your CSM or AE for further clarification.
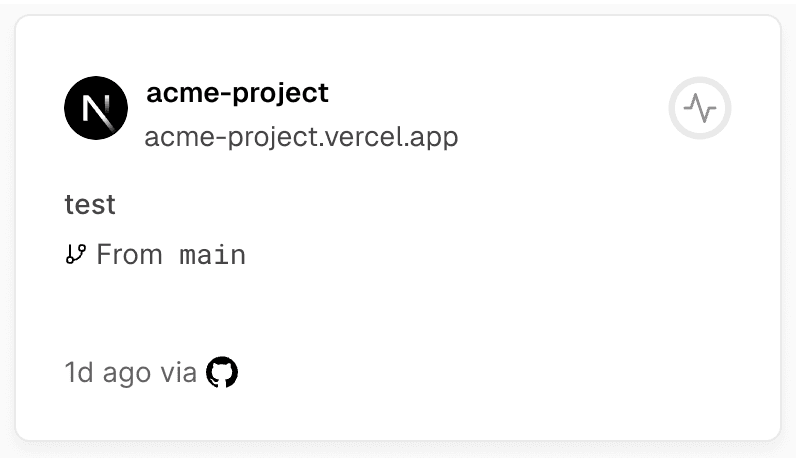
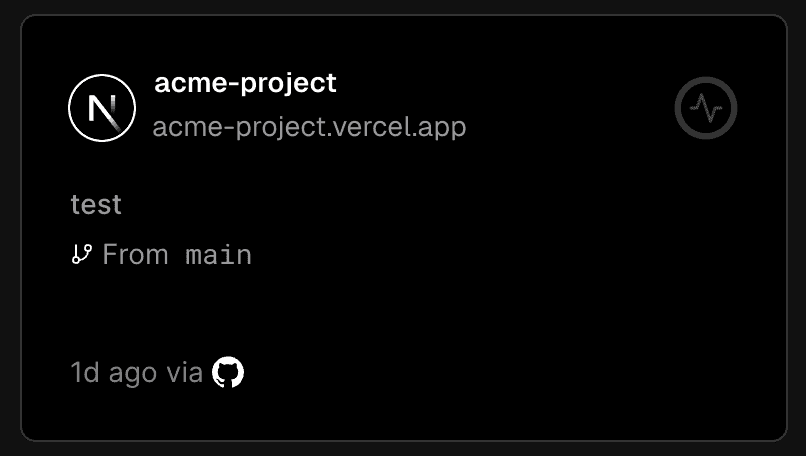
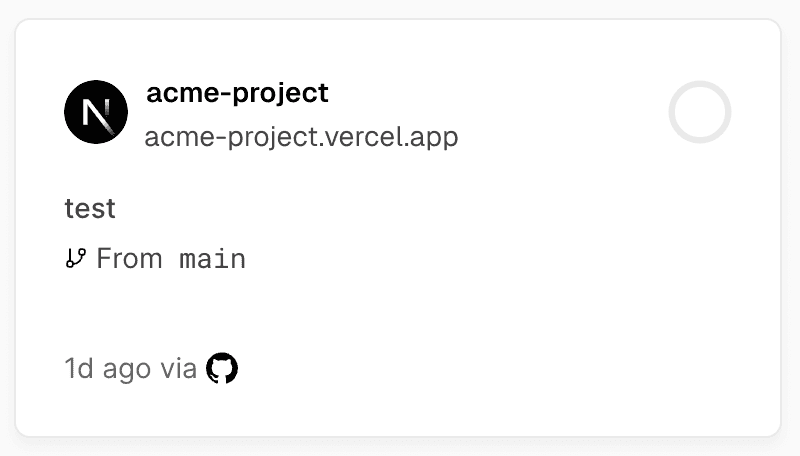
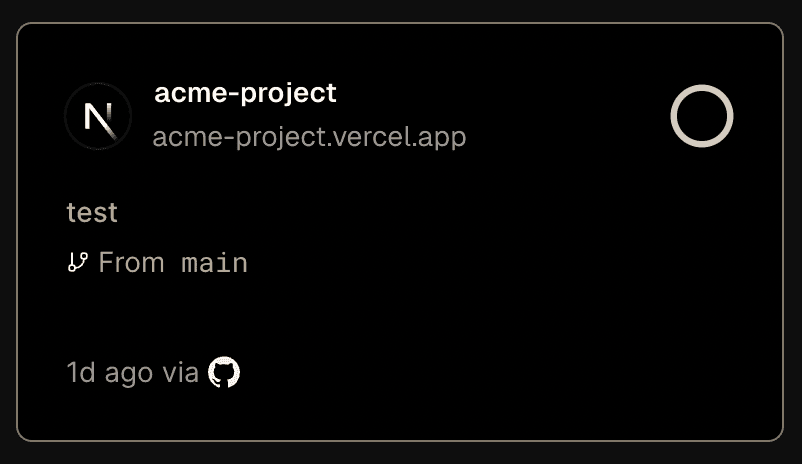
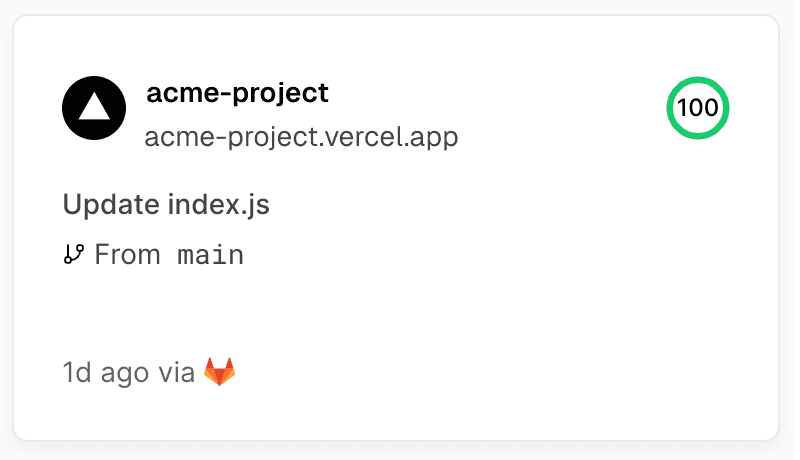
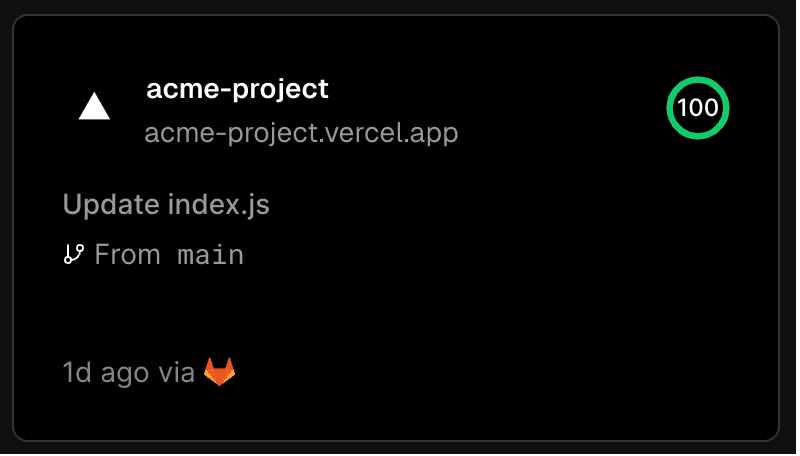
If you have many projects on your Vercel account and are not sure which of them has Speed Insights enabled, you can see this from the dashboard without needing to check each project separately. The different circles in the right corner of each project card will show the Speed Insights status.
If Speed Insights is not enabled, then the circle will be gray, with the speed insights logo. For example:
If Speed Insights is enabled but no data points have been collected yet then it will show an empty circle, like the below:
If Speed Insights is enabled and data points have been collected then the circle will be colored with a number inside, similar to the below image:
Was this helpful?